Our Aging Population
Health Infographics

Our Aging Population

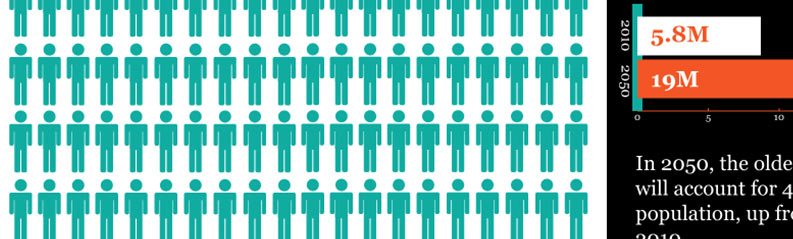
In 2011, Baby boomers started turning 65, signaling a big shift in demographics throughout the world. by the year 2035 in the United States, 1 in 5 citizens are likely to be age 65+. The aging population of America has a deep negative effects for society, for policy makers and for businesses. See also The Science of Getting Old.

Specifications

Published by
All Assisted Living Homes
Infographic Elements  
line graph, bar graph, pie chart

Our Aging Population Infographic

Grade this Infographic
Your Grade
Rate Here
Visual Design
7.5
Informativeness
7.5
Understandability
8.3
Accuracy When Created
8.3
SHARE
7.9
Your Grade
2 ratings
You have rated this
Infogrades Staff
Infogrades is a curated directory of all types of info-graphic design. We handpicked the informative, entertaining and well-design to showcase, and let you grade them.

Last Updated:

25/04/2017