Tag: data visualization
-

Comparing Minimum Wage in Different Countries
Minimum wages varies across countries and commonly based on the cost of living and government policy. $7.25 per hour was the current minimum pay rate in the United States. However, there are 29 states that have a higher minimum wage than the federal rate. But how does the US’s hourly rate of pay stack up…
-
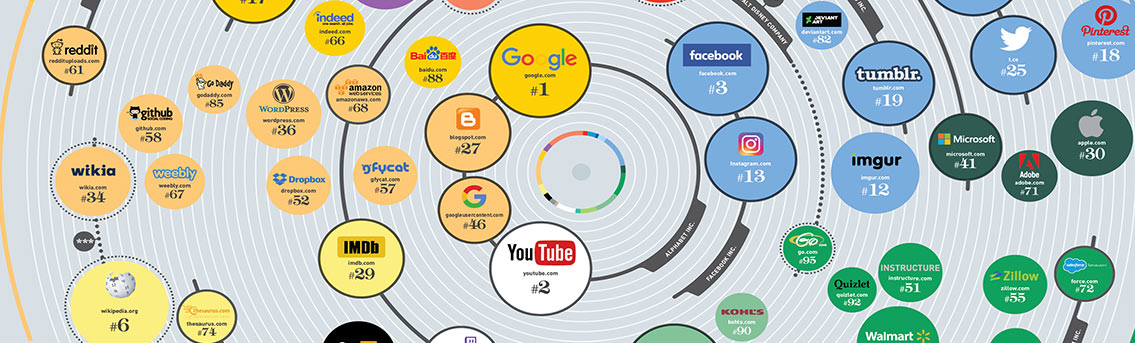
100 Most Visited Websites in the US
Nearly 290 million Americans are now have internet access, according to Statista. Like you, millions of them have similarly favorite websites to visit. Alexa Internet, Inc. makes it easy to see the most popular sites in the world with highest traffic. Alexa’s analytics calculates the number of visitors on websites, rank the list and make…
-
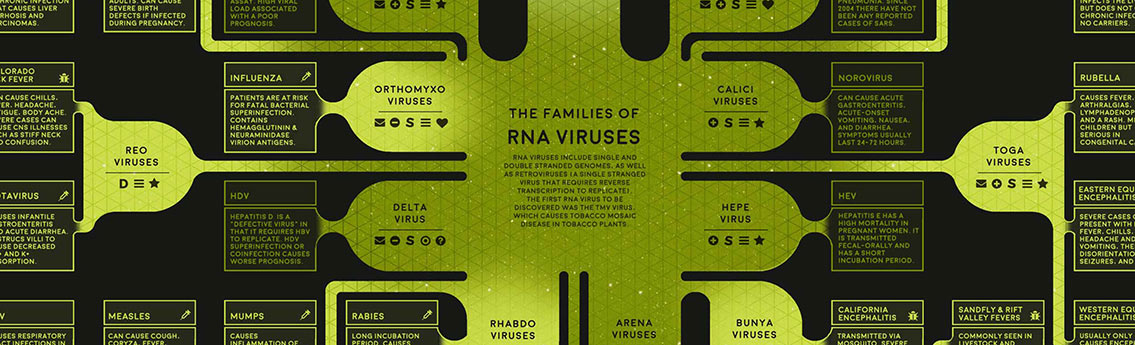
Different Types of Viruses in Biology – Flowchart
Scientists have been studying various types of viruses for decades. Some contagious viral infections in humans, like chickenpox, smallpox and measles, can be conquered with vaccines. Some dangerous viruses like the bubonic plague, swine flu, Lassa fever, ZIKA and SARS can infect and kill a group of vulnerable people to start an outbreak, spreads rapidly…
-

The Chart of Space Exploration Missions
Since Sputnik launched into orbit back in 1957, humanity had pushed the boundaries of space exploration missions to expand the knowledge of our solar system and beyond. Since its creation in 1958, NASA has achieved some pretty impressive feats of science. Space probe Voyager 1 has been silently traversing the unknown territories of the universe…
-

Asteroid Mining: A Gold Mine In Space
Mining asteroid for rare and precious metals is not a sci-fi dream anymore. Several space mining companies are already preparing for an out-of-this-word gold rush – mining asteroids for important resources needed to construct space colonies, spacecrafts and other things humanity needs to survive. Those massive celestial rocks contain materials like iron, nickel, cobalt, platinum…
-

The Sleeping Time of Different Animals
Animal’s sleep habits and resting time differ among species including human beings. Some mammals can sleep for almost a whole day and some for less than an hour that they can’t experience REM(Rapid Eye Movement). Some of them, like cows and horses, can do napping while standing up. Giraffes can stay awake for weeks without…
-

Extinct and Endangered Species of Vertebrate Animals
Sometimes the vanishing of animals into extinction can be traced back to one single cause. In today’s rapidly changing world, extinct species are caused by a number of contributing factors like natural selection, predation by other species, endemic diseases and effects of human activity. The following data visualization reveals the decade-by-decade extinction of vertebrate animals,…
-

The Cheapest and Most Expensive Flights in the World
Flights are becoming more expensive in an ever changing economic climate. Even a few domestic airfares cost over $1,000 per round-trip ticket. And when you upgrade classes or opt for an international destination, your expense is going to get a lot higher. For the rich and famous, that’s not a problem. While a lot of…
-

End of the Road: Deaths in Formula One
From the 1960s to early 1980s , the number of drivers who died racing in Formula One was alarming. This infographic list all the fatalities and infamous crashes happen at the F1 circuit. Thanks to noticeable advancements in safety standards, the death count and reported injuries in the sport has drastically reduced. See also The…
-

The Fallen of World War II
Created and narrated by Neil Halloran, The Fallen of World War II is an incredible data visualization, revealing the casualties of world war 2 by country. The film chronicles the deaths of soldiers as well as civilians, after which Halloran places those massive numbers into context comparing the wars that followed before and after. See…