Category: Science Infographics
-

-
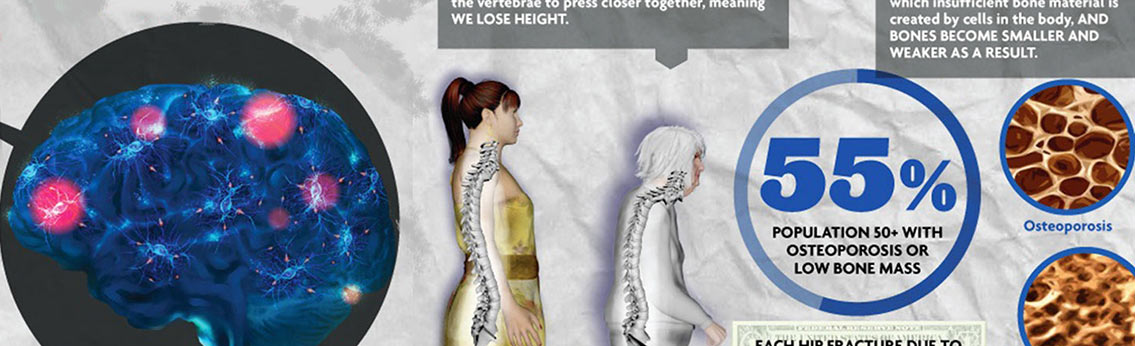
The Science of Getting Old
As we age, our body enter a biological aging process in which our system naturally deteriorate and we become more vulnerable from everyday wear and tear. At old age, many important physical and mental functions stared to fail. This graphic answer the commonly ask questions about human aging; why do we age, why our hair…
-
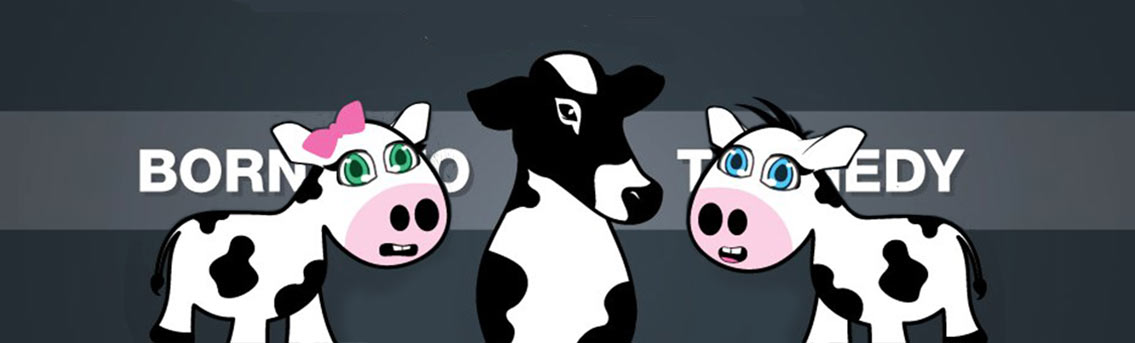
The Life of a Cow
In a natural environment, cows can live up to 20 years. When a cow is born in a dairy farm, he or she is separated from her mother within just 24 hours of birth. Mothers are placed back to the milking herd in order to maximize profits. Male calf are chained for 16 weeks before…
-

-
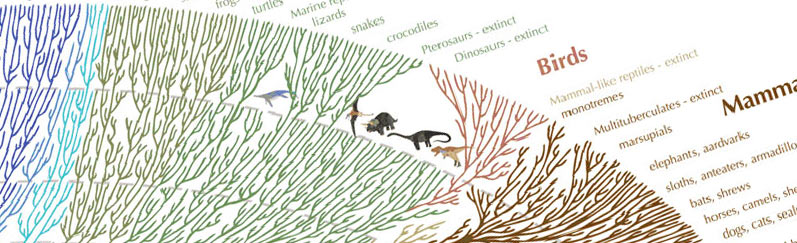
The Tree of Life
Leonard Eisenberg collect all the living things on Earth and put it on one big and colorful family tree. Eisenberg show all the major and few of the minor branches of life connected to a geologic time scale. See also the Extinct and Endangered Species of Vertebrate Animals and the another perspective of the Geological…
-

Geological Time Spiral
Bazar Shop is a popular multipurpose WooCommerce theme made by YiThemes.
-

-
-

Comparative Geography of Mountains and Rivers from 1854
This vintage infographic was published in 1854 during the Victorian times. Many of the famous and old graphical charts came from that era. It illustrate Earth’s longest rivers and highest mountains side-by-side. All the mountains and rivers are organized in descending and ascending flow. If you’re wondering what those numbers means, check out the legend…
-

How Long Do Animals Live (1939)
Bazar Shop is a popular multipurpose WooCommerce theme made by YiThemes.