Science Infographics

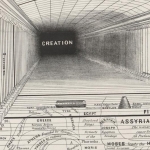
How Long Do Animals Live (1939)

In 1939, Compton’s Pictured Encyclopedia publish a simple yet clever infographic that show the life expectancy of animals using ISOTYPE technique. An ISOTYPE is a visual language for making icons and the concept of using multiples to exhibit quantitative data. The zig-zag lifeline on this ISOTYPE chart is an intelligent solution for squeezing a long timeline in to one single page.

Specifications

Published by
Compton’s Pictured Encyclopedia
Infographic Elements  
ISOTYPE
Designed by
Gerd Arntz
Associated Topics  
animal, life expectancy

How Long Do Animals Live by Gerd Arntz 1939 - Vintage infographic

Grade this Infographic
Your Grade
Rate Here
Visual Design
8.6
Informativeness
7.6
Understandability
7.5
Accuracy When Created
5.6
SHARE
7.3
Your Grade
15 ratings
You have rated this
Infogrades Staff
Infogrades is a curated directory of all types of info-graphic design. We handpicked the informative, entertaining and well-design to showcase, and let you grade them.

Last Updated:

26/04/2017